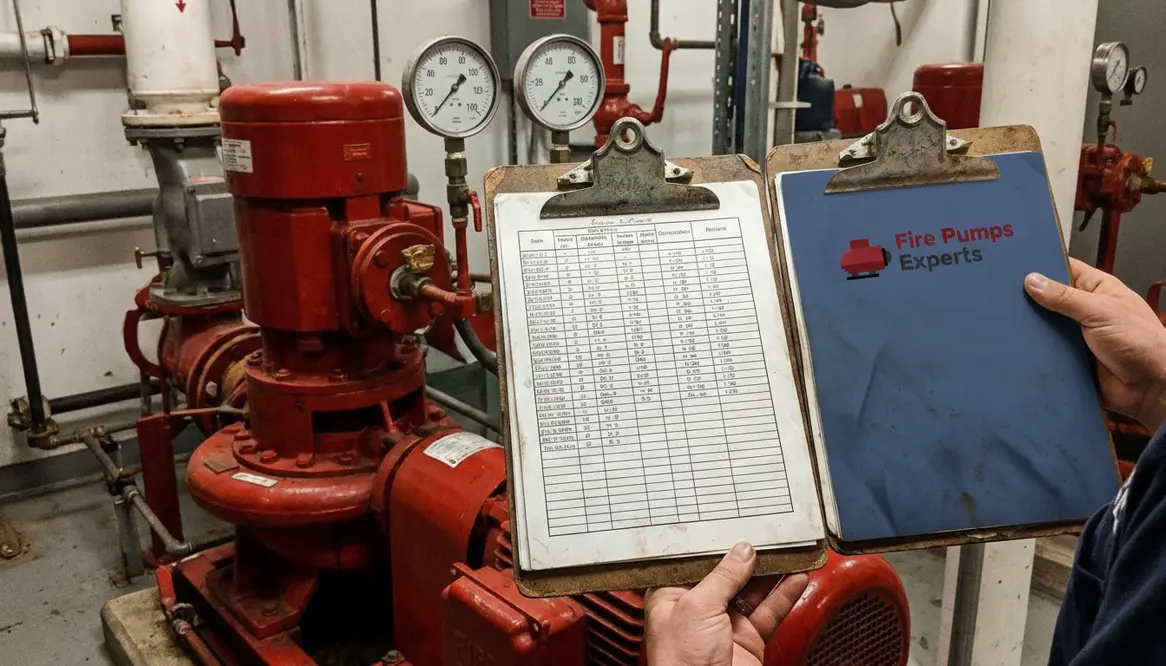
How I Compare Fire Pump Test Results Year Over Year
When I review an annual fire pump test, I am not just checking a box. I am looking for the quiet little warning signs that tell me whether a system is still strong, still steady, and still ready for a real fire event. A good fire pump testing record can look fine at first glance, while a deeper fire pump inspection may reveal drift in pressure, flow, or starting performance. That is where the year over year comparison matters. It helps me spot change before change turns into trouble, and in this line of work, that is the difference between peace of mind and a very bad day.
Start with the numbers that matter most
I begin with the same core data from each test. I compare suction pressure, discharge pressure, pump speed, churn performance, flow at rated capacity, and driver performance. Then I line them up side by side. If I see a drop in discharge pressure, I do not shrug and blame the weather like a sitcom character dodging responsibility. I ask why it changed.
The real value comes from trends. One odd result may point to a temporary issue. However, two or three years of the same slide can show wear, blockage, valve trouble, or an aging driver. So, I always compare the latest annual fire pump test against past reports, not just the one from last year. Time tells the truth, even when equipment tries to keep secrets.
How I read trends without getting fooled
I look for patterns, not drama. A small dip in flow might be normal if the water supply changed slightly. On the other hand, a steady loss in pressure or a rise in vibration can signal deeper trouble. Because of that, I keep one simple rule in mind: do not compare one number alone. Compare the full story.
Here is what I check most often:
- Pressure changes across multiple years
- Flow rate stability at rated and peak demand points
- Churn performance and any rise in heat or noise
- Driver behavior during start, run, and shutdown
- Test conditions that may explain a shift
Also, I never ignore the test setup itself. If the test method changed, the results may not be apples to apples. And yes, the fire pump can be judged unfairly if the test rig acted like it had its own opinion.
Compare results in a simple two column view
When I want a fast read on change, I use a side by side layout. It keeps the facts clean and easy to scan. For example, I place the prior year in one column and the current year in the other. Then I mark the difference and note the cause if I know it.
Prior year
Rated flow met with stable discharge pressure, normal start time, and no unusual vibration.
Current year
Rated flow met, but discharge pressure dropped slightly, start time slowed, and vibration increased at higher load.
This kind of view helps me see whether the system is holding steady or drifting. It also makes reporting easier for facility teams, owners, and service partners. In large commercial and industrial properties, that clarity matters because a fire pump is not decoration. It is a core life safety asset, and it deserves grown up attention.
What causes a year over year shift
Several things can move the results, and I treat each one like a suspect in a calm little mystery. Water supply changes are common. So are worn impellers, leaking seals, closed valves, clogged strainers, control issues, and engine or motor problems. In some cases, the fire pump testing process itself reveals that the system has been working harder than it should.
Environmental factors matter too. Heat, corrosion, and poor room conditions can change performance over time. Therefore, I also inspect the pump room, piping, controls, and power source. If the space feels neglected, the equipment often follows that mood. Machines, like people, do not thrive in chaos.
Use the test history to decide next steps
I do not stop at comparison. I use the trend to decide action. If the results stay flat, I keep the current maintenance plan. If the numbers slip a little, I schedule a closer look. If the decline keeps going, I push for repair, replacement, or a deeper engineering review. That is the whole point of comparing year over year: it turns raw data into a decision.
For commercial facilities, industrial sites, and major property buildings, this approach helps protect uptime, reduce surprise failures, and support compliance. I also like to keep service records tied to the broader fire protection plan. For example, if you need a related resource, I recommend reviewing los angeles fire pump service details and then making sure your documentation stays aligned with ongoing fire pump inspection schedules.
When it comes to fire pump testing, I follow practical cadence so results remain meaningful and the system does not get time to wander. In many environments, a 4 times minimum check rate for relevant operational testing supports consistency, especially when multiple pumps, jockey pumps, or control strategies are involved. The goal is not to flood the schedule, it is to keep the performance story readable over time and avoid the “everything looked fine until it did not” moment.
FAQ
Quick answers, no fluff
Conclusion
When I compare fire pump test results year over year, I get more than numbers. I get a map of system health. That map helps me catch decline early, plan smarter maintenance, and protect commercial and industrial buildings before problems grow teeth. If you want a clearer view of your fire pump performance, I suggest reviewing your full test history now and speaking with a qualified service team before the next annual cycle arrives.