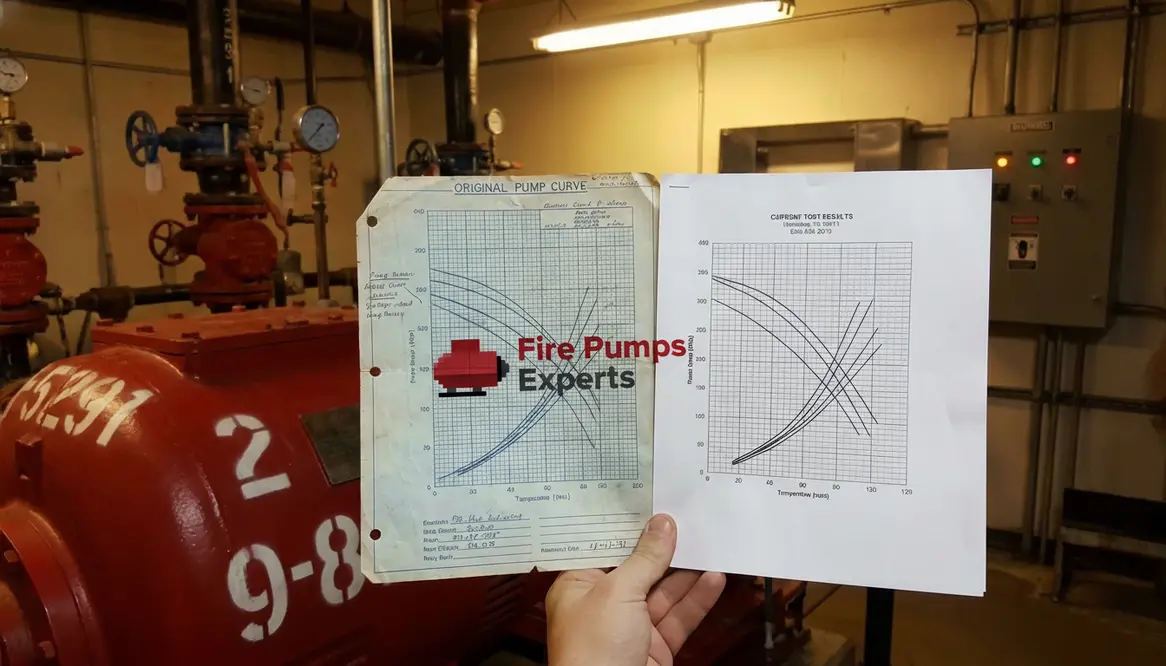
Compare Current Fire Pump Test Results to Original Curve
How I Compare Current Fire Pump Test Results With the Original Pump Curve
When I compare current fire pump test results with the original pump curve, I am not just checking numbers on a page. I am looking at the pump’s health, its duty point, and whether it still protects a commercial or industrial building the way it should. That matters because a fire pump that drifts from its original curve can hide wear, blockage, bad valves, or even a system change that nobody wrote down. In other words, the curve tells the truth, even when the rest of the system tries to act innocent. Like a villain in a decent action movie, the problem often shows up first in the details.
Why I start with the original pump curve
I always begin with the original pump curve because it gives me the benchmark. It shows the flow and pressure the pump was built to deliver at test conditions. Without it, I am guessing, and guessing is a fine hobby for trivia night, not for fire protection in a large facility.
I check the original submittal, the factory curve, and any accepted shop drawings. Then I confirm the pump type, driver, rated speed, and test basis. I also make sure I am comparing the same model of test against the same curve. A diesel pump and an electric pump may both look heroic in a control room, but they do not always age the same way. If the system changed since startup, I note that before I compare anything.
How I read current fire pump test results
I look at the current test results in a simple order. First, I review churn, rated flow, and overload flow. Next, I compare pressure at each point to the original curve. Then I watch for the shape of the line, not just a single number. One good reading can fool you. A full trend rarely does.
Here is the practical method I use:
Step one: I match the test point to the original curve point.
Step two: I compare pressure loss or gain at each flow.
Step three: I check if the pump still meets the expected performance range.
Step four: I look for a curve shift, a flat spot, or a drop in slope.
That last part matters a lot. A pump can still “pass” and yet slowly drift away from its original shape. That is the kind of problem that likes to wear a fake mustache and sneak past lazy reviews.
What I look for when the curve does not match
When the current test curve no longer lines up with the original, I ask what changed. Often, I find one of a few common causes. Sometimes the suction supply changed. Sometimes valves do not fully open. Sometimes the impeller wears, the packing loses efficiency, or the driver does not perform as it should.
I also look for signs of test error. A bad gauge, a weak flow meter, or an incorrect test setup can make a healthy pump look tired. So I never blame the pump too fast. I verify the tools, the test method, and the field conditions first. That keeps me honest, and honesty matters when a building depends on the result.
How I compare test data to code and design limits
I do not stop at “it looks close enough.” I compare the results to the curve and to the project or code requirements that apply to the facility. For commercial and industrial properties, that means I check whether the pump still supports the demand of the fire protection system under real conditions.
At this point, I also review the system context. Has the building added risers, storage, or new hazards? Has the water supply changed? Has the pump room stayed in good shape? These questions matter because a perfect curve on paper means little if the building grew up and the pump stayed in the past. That is where a fire pump test curve comparison becomes more than math; it becomes a timeline of what changed and when.
Original curve
Factory or approved baseline
Expected pressure at each flow point
Shape shows how the pump should perform
Current test curve
Real world field result
Actual pressure at each flow point
Shows wear, change, or test error
This side by side view helps me spot drift fast. It is simple, clear, and far less dramatic than trying to explain a bad curve after an incident review. Nobody enjoys that meeting. Nobody.
Where I find useful guidance and next steps
When I need extra support, I use trusted references that fit the system and the region. For example, I review this AS 2419 fire pump and hydrant performance guide to help frame performance checks and expectations. I also use los angeles fire pump service information as a local SEO friendly reference point for commercial and industrial fire pump support.
After that, I decide what the result means. If the curve stays close, I document it and move on. If the curve shifts, I schedule repair, deeper inspection, or re testing. I also explain the result in plain language so the owner, facility team, and fire protection contacts can act without delay. In a proper fire pump test curve comparison, the goal is not to win an argument, it is to keep the pump in its lane.
FAQ
Final CTA
If you manage a commercial or industrial facility, do not wait for a weak pump curve to become a hard lesson. I recommend reviewing your current test results against the original curve now, while there is still time to act cleanly and calmly. If you want a sharper read on performance, document the trend, inspect the system, and bring in expert support before a small shift turns into a big problem. Your pump should be ready long before the alarm ever speaks up. When you do a fire pump test curve comparison the right way, you protect the building and you protect your future self from an uncomfortable incident review.